By Greg Suttor & Scott Leon
The 2016 census paints a picture of rapid changes and new trends in rental housing in the Toronto area. This bulletin focuses on six highlights from the new data released by Statistics Canada on October 25, 2017 (www.statcan.gc.ca/daily-quotidien/171025/dq171025c-eng.htm?CMP=mstatcan ).
-
Rental housing dominates recent growth and change
Toronto-area growth was predominantly in rental housing in the five years from 2011 to 2016.
Of the net 146,000 households added, 85,000 or 58 percent were renting their home. This has changed the overall balance between owners and renters in the Toronto area, raising the share who rent from 32 percent to 35 percent of our 2.1 million households.
This dominance of rental is a big change from the preceding two decades when homeownership rates rose significantly. It is a reversal from the prior census period (2006 to 2011) when the rental sector grew by just 60,000 households while the homeowner sector grew by 140,000.
Not since the 1960s and 1970s has rental housing been so prominent in Toronto’s growth.
This change relates to home purchase being less affordable – although the census does not tell us this directly. Many Torontonians have to rent longer and buy later in life, or are unable to buy a home at all.
This plateauing or declining ownership rate echoes similar shifts in other countries. High prices, wide income disparities, and challenging job markets put limits on how high the homeownership rate can go.
The prominence of renting also relates to the arrival in the housing market of the millennial generation. Although the number of renters rose in every age bracket, the big increases were in the 25-34 and 55-75 age groups, with an extra 29,000 renting households in each of these.
-
Condo rentals have grown rapidly
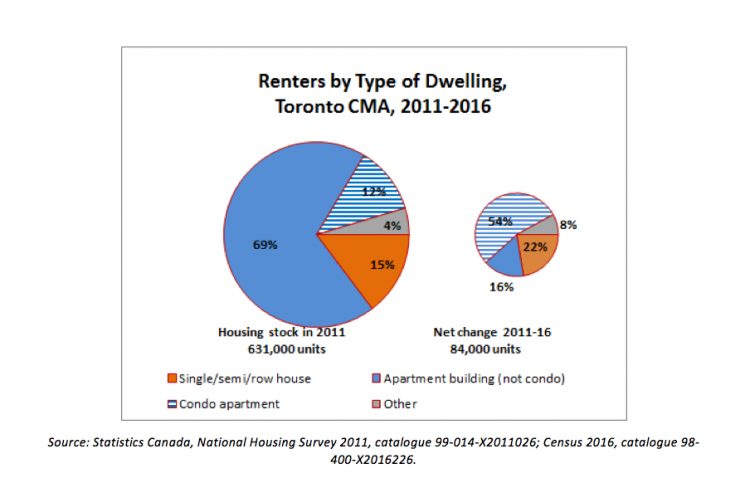
The Toronto area added 45,000 condo renter households from 2011 to 2016.
The percent of renters living in condos shot up from 12 percent to 17 percent of all renters in this short period. With almost flatlined numbers of units in conventional all-rental buildings, the latter shrank in relative terms by a similar proportion. The share of renters in houses or other dwelling types (duplexes, etc.) did not change much.
-
Millennials’ ability to own homes and afford rent has declined
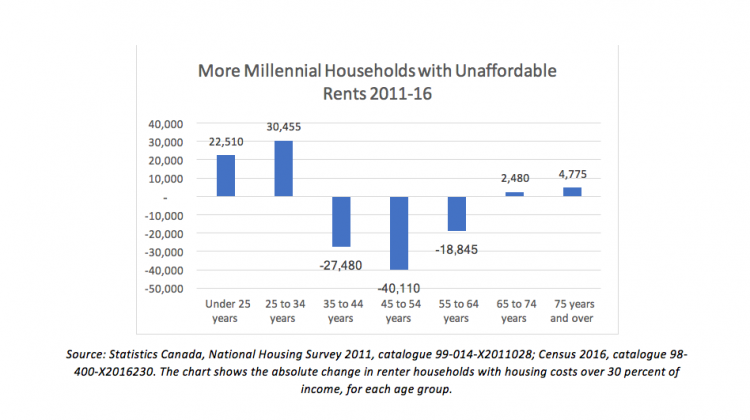
People under age 35, the millennial generation, saw their housing affordability and homeownership rates deteriorate in 2011-2016.
The census reports the number of people paying over the 30 percent of gross income on rent – the standard benchmark for affordability problems. Fully half of millennial renters are overburdened in these terms, up from one third in 2011. By 2016 over 100,000 Toronto-area households under 35 paid more than that affordable benchmark – about twice the number in 2011.
For millennial homeowners it is not much better. Among households maintained by a person under 35, the share owning their homes has decreased markedly, down 6 percent to 39 percent owning in just 5 years. And over 41 percent of homeowners under 35 struggle with housing costs, up from 36 percent in 2006.
This is a divergence from the pattern for households maintained by a person age 35-64. In this group the numbers over the affordability benchmark decreased by 80,000 over the same period. The ownership rate in the 35-64 cohort slipped only 1 percentage point.
-
Rents are rising and high-end housing stock is increasing
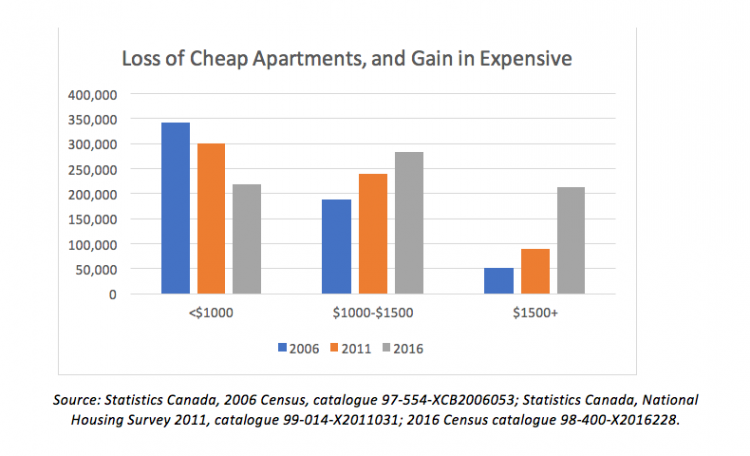
The overall balance between lower, mid-range, and upper rents has shifted dramatically.
The number of dwellings renting for under $1,000 a month declined by 122,000 – or 1 in every 6 rental units. Meanwhile the number renting for $1,000–$1,499 monthly rose by 96,000 and the number costing $1,500 or more surged by 163,000. In 2011 just 9 percent of rented dwellings cost $1,500 and up, but this rose to 30 percent of rented dwellings by 2016.
The census data cover all rented dwellings – a much fuller picture than the annual data provided by Canada Mortgage and Housing Corporation’s rental market survey. At this stage the census data do not tell us how much change has happened in finer-grained rent categories.
This upward shift in rents is not simply a matter of “bracket creep” (for example, a rent of $900 five years ago has almost the same inflation-adjusted value as $1,000 today) or of guideline increases for sitting tenants. The changes in rent are far larger than that.
This surge in high-end units is closely related to the huge growth of condo rental, noted above, as well as huge demand pressure following several years of relatively slack rental markets.
-
More affluent people are renting
Most increase in renters has been among households above-average incomes – people able to afford those high-end rents. Between 2011 and 2016, the Toronto area added 17,000 more renter households with upper-middle incomes ($80,000-$100,000), and 34,000 more with incomes over $100,000. The number of renters with lower incomes has grown much more slowly.
The flipside of this is very little growth in homeownership except among affluent households. In the decade between 2006 and 2016 (and similarly in 2011-2016), virtually all increase in homeowners was at incomes over $100,000. This reflects high home costs.
-
Housing stress has stayed at about the same level
Housing stress refers to problems with affordability, disrepair, or crowding, as measured in the census.
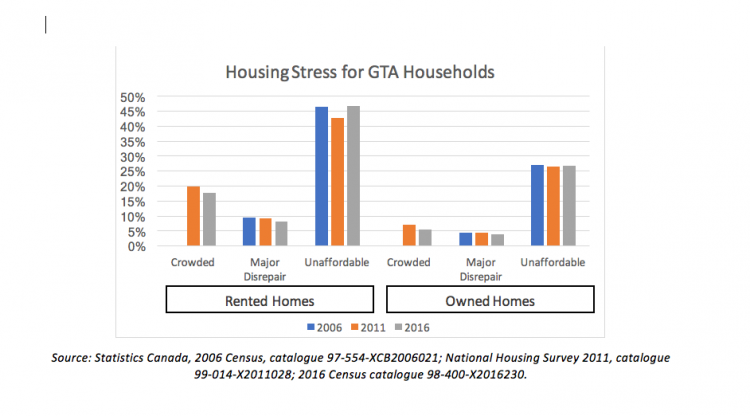
Housing stress in the Toronto area was little changed or slightly improving in 2011-2016. Although this is positive, the number of households with unaffordable rents remains high. Renter households are more than twice as likely as homeowners to live in housing that is crowded or in disrepair.
The percent of renter household living over the affordability benchmark rose from 2011, but was much the same as in 2006 at around 45 percent of renters. Data on severe affordability problems – paying more than 50 percent of household income on rent – are not yet available for 2016.
Crowding is down modestly in the Toronto area, by about 2 percentage points for both renters and owners. Crowding in renter households however remains roughly 3 times higher than in owner households.
The percent of renter households living in housing in disrepair has edged down from 9 percent to 8 percent of renter households.
Minor changes in affordability and disrepair between the 2011 NHS and 2016 census should be viewed with caution: small differences may not be meaningful due to different methods of data collection.
A note on data and categories
- The data provided here are mostly for the Toronto Census Metropolitan Area (CMA). This is similar to the GTA, extending west to Oakville, north beyond Newmarket, and east to Ajax. It represents the built-up urbanized area of Greater Toronto, and its housing market, labour market, and daily commuter zone.
- A household is a group of people living together in one dwelling unit. This can be a family with children, a couple, a single person living alone, or other related or unrelated people sharing a dwelling.
- The focus is net change. For example, if condo rental grew by 45,000 households, this is the net result of various changes – new condos built and rented, vacant units getting occupied, owners moving away and renting out the unit, rental buildings converted to condominium, etc.
- Comparative 2011 data are from the National Household Survey. While the NHS was not always reliable for small geographic areas, it was largely reliable at larger scales such as the CMA.


